Stock Screener by R. P. Sarathy

Four stock screens in your inbox before the open.

Every weekday morning, four pipelines scan the S&P 1500 for earnings chatter, volume spikes, accelerating revenue and price momentum, then email what they find. It's free, and anyone can join.

What the emails look like

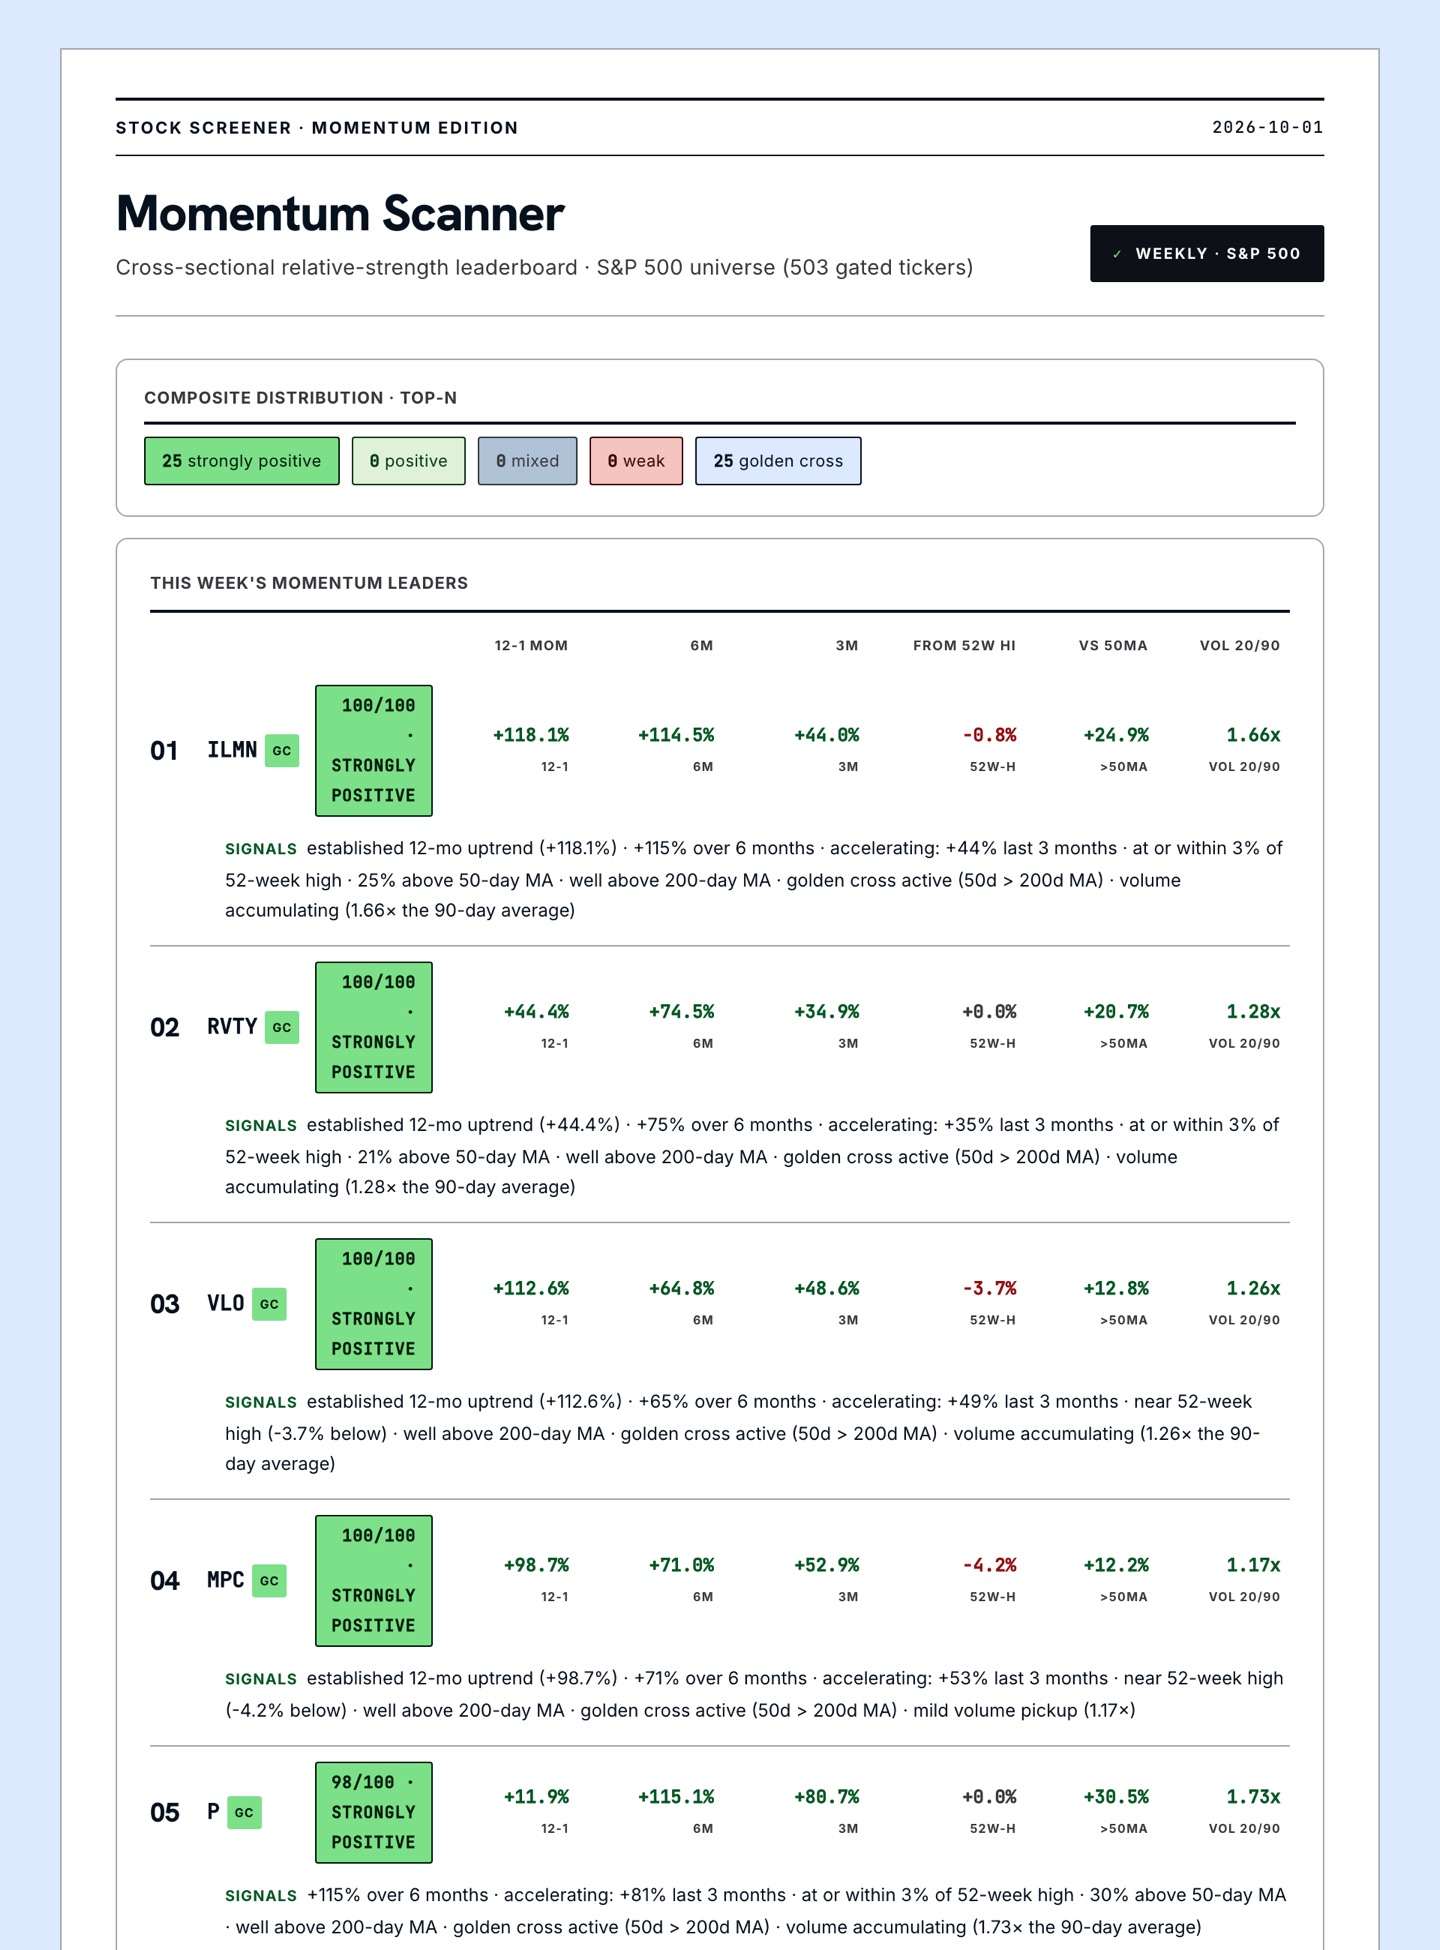
Real emails from the pipelines, captured on October 1, 2026. Each one is a single scrollable page you can read on your phone before the open.

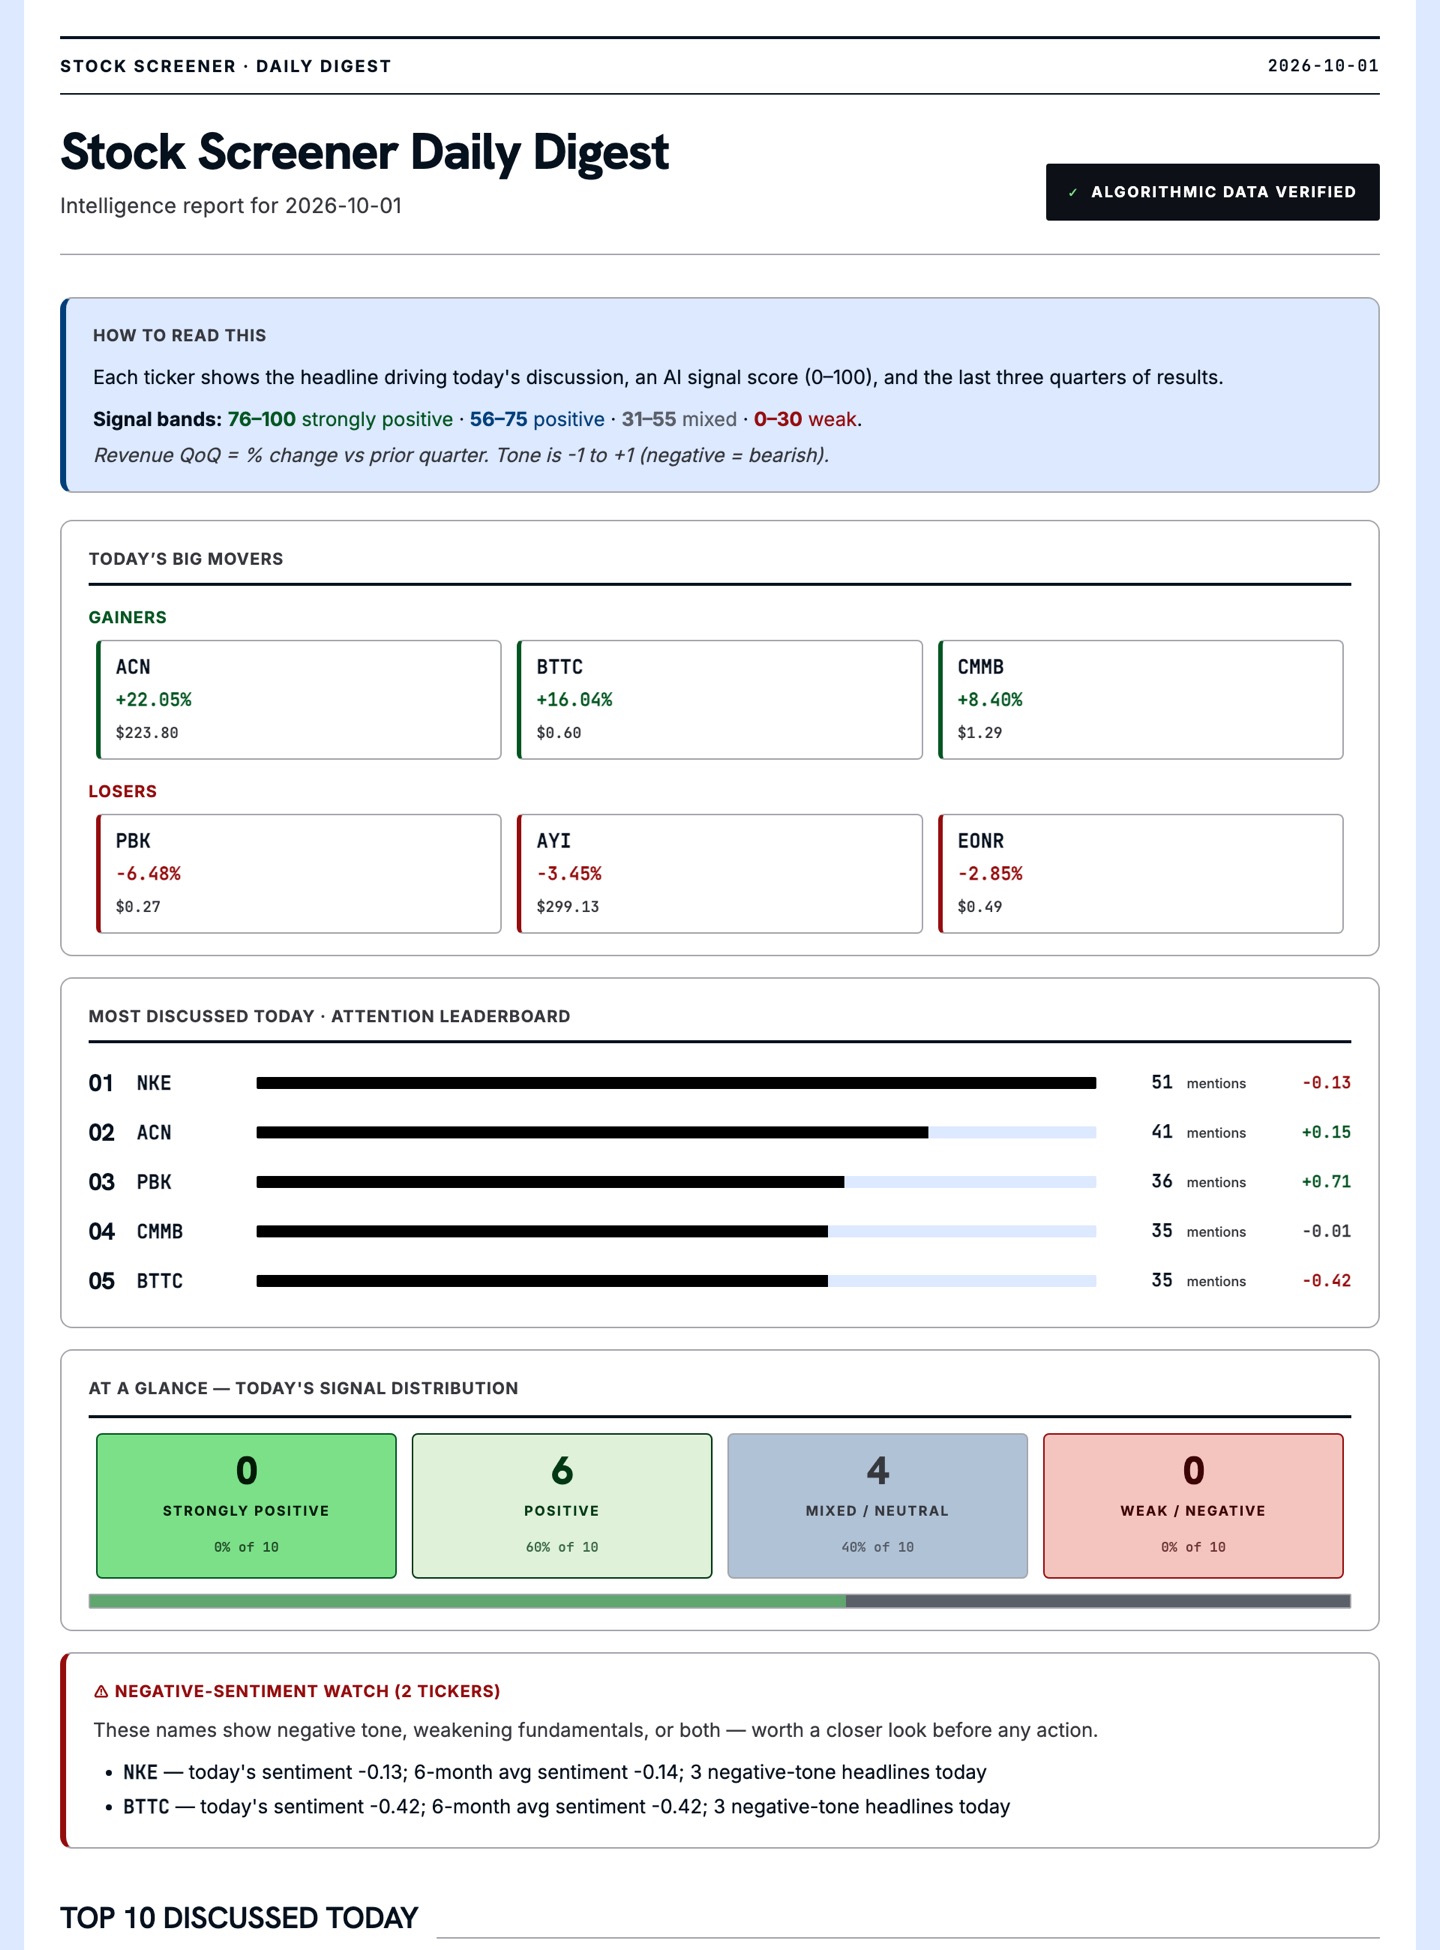
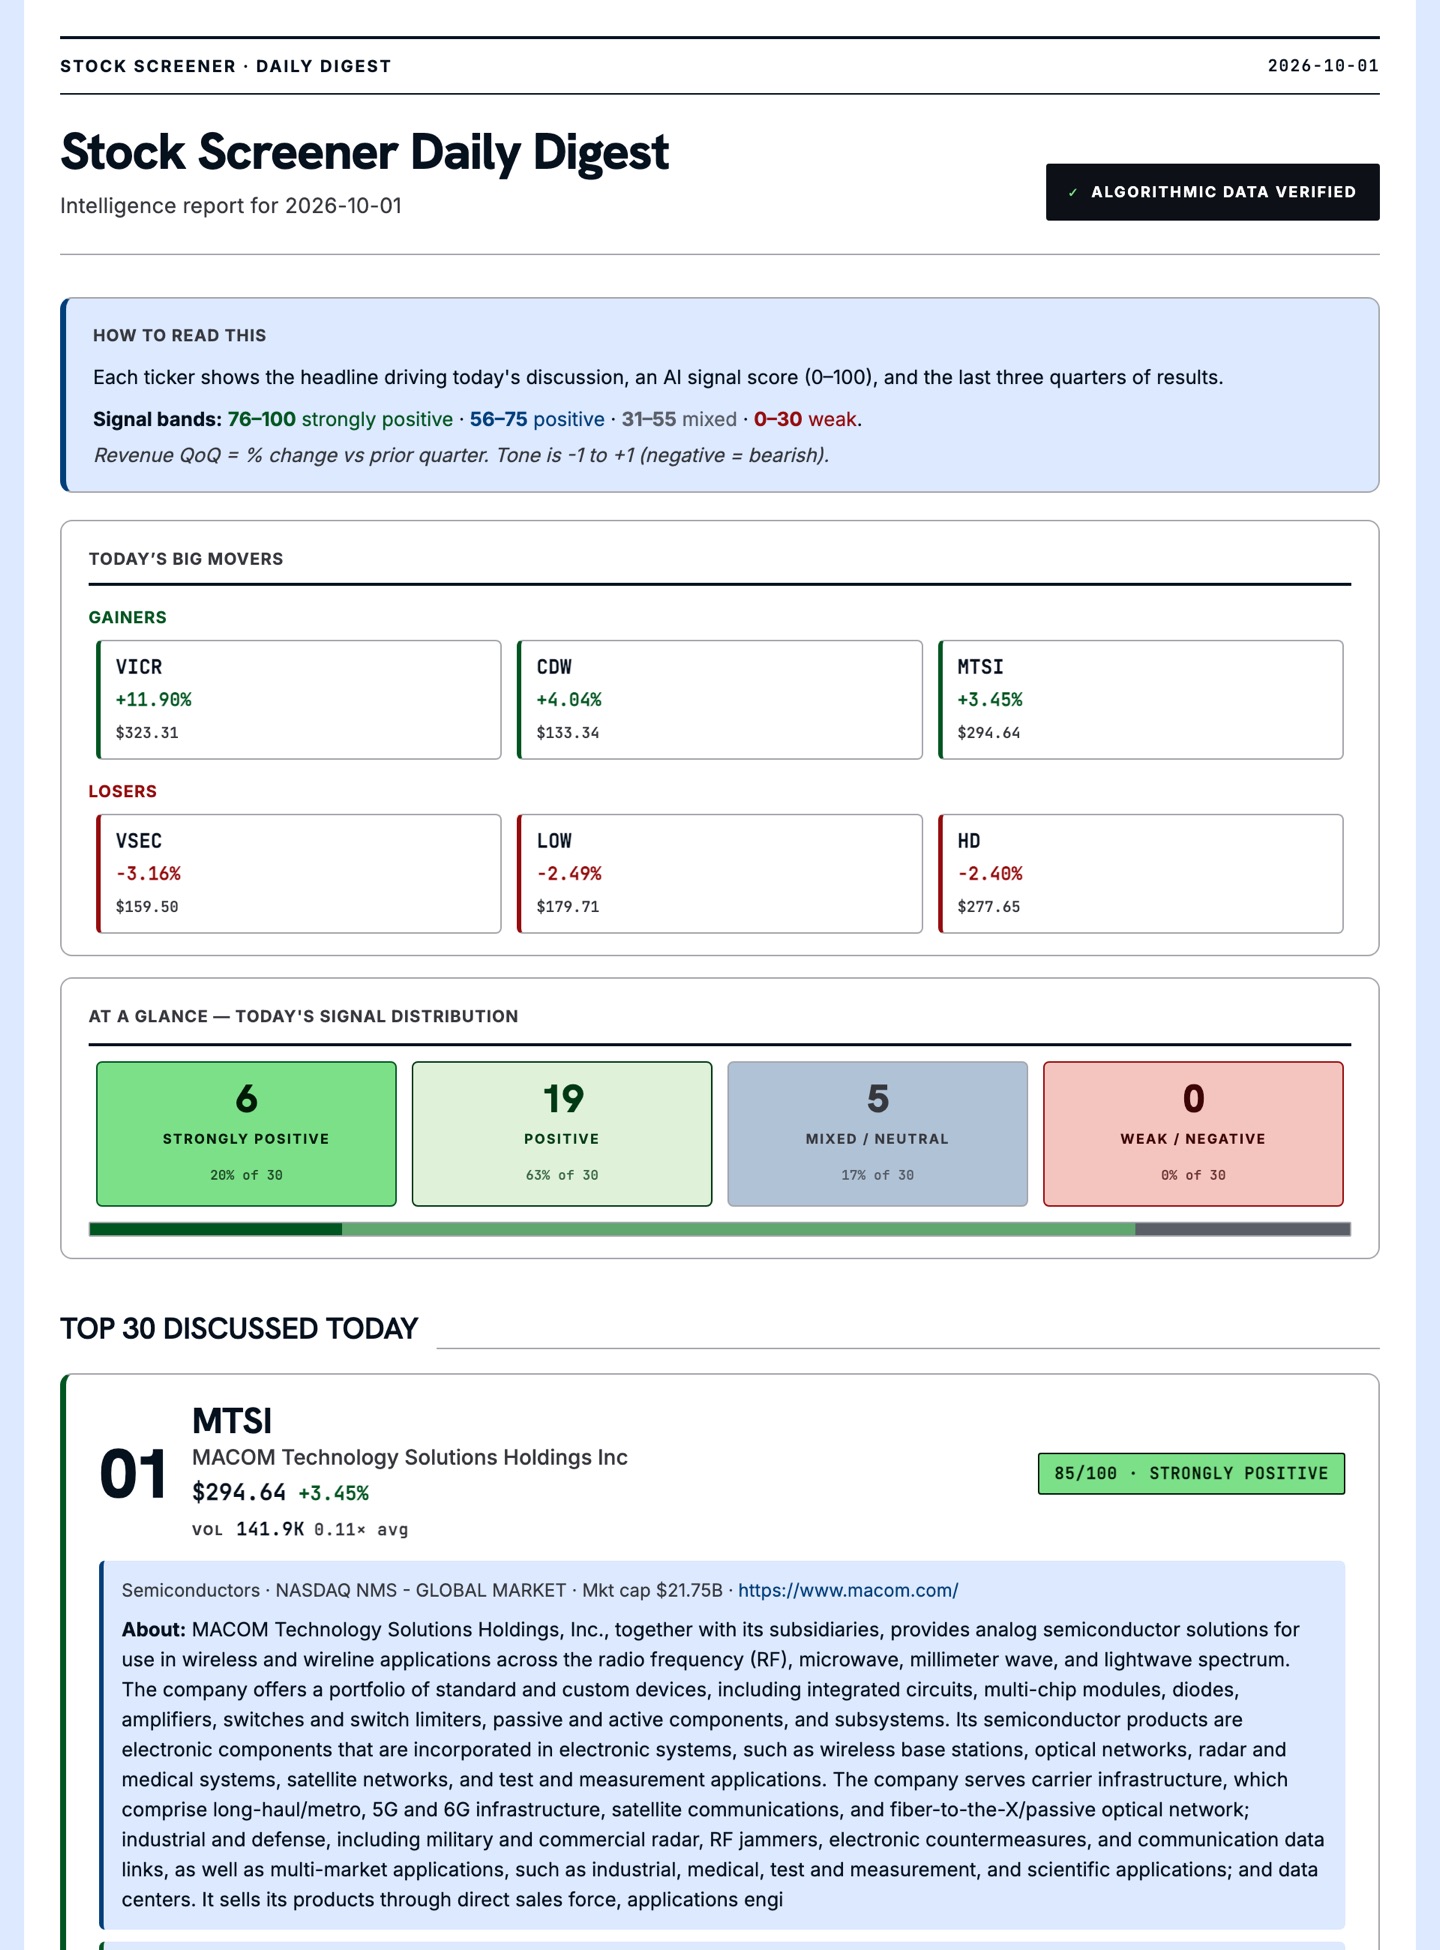
Stock Screener Digest
Screenshot of the Daily digest email: movers, attention leaderboard and AI signal distribution

How each pipeline works

Each screen is a fixed set of steps that runs the same way every morning. The rules are below so you can judge the output for yourself. The run starts at 7:00 Eastern and each email goes out as soon as its pipeline finishes.

Daily digest

Earnings days are when attention and new information collide. This screen asks which of today's reporters people are talking about, and whether that talk is backed by real growth.

Sources: Alpha Vantage earnings calendar, Finnhub news, Reddit, StockTwits, Bluesky, Hacker News, Polymarket, Yahoo Finance

  1. Find reportersPull every company reporting earnings today.
  2. Gather chatterCollect the last 24 hours of posts and news, filtered to established accounts.
  3. Score 0–100Sentiment 35%, buzz 20%, revenue growth 20%, agreement 15%, EPS growth 10%.
  4. ResearchClaude reads the web on the top names and writes a short thesis for each.
  5. Send top 10Ranked list with score, summary and the evidence behind it.

Unusual volume

Heavy buying in a smaller company often shows up in volume before it shows up in the news. This screen catches stocks where trading jumped and the price rose with it.

Universe: S&P MidCap 400 and SmallCap 600
Source: Yahoo Finance daily prices

  1. Load pricesDaily price and volume for about 1,000 small and mid caps.
  2. Compare volumeLatest session's volume divided by the 30-day average.
  3. FilterKeep stocks at 1.5× normal volume or more that closed up on the day.
  4. Send top 20Sorted by how far volume ran above normal.

Accelerating revenue

Growth that keeps speeding up is rarer than growth that's merely high. This screen looks for companies whose quarter-over-quarter revenue growth has climbed four quarters in a row.

Universe: S&P 500, MidCap 400 and SmallCap 600
Source: Yahoo Finance quarterly financials

  1. Load revenueThe last five quarters of revenue for each company.
  2. Compute growthFour quarter-over-quarter growth rates.
  3. FilterEach rate must beat the last, and the latest must be positive.
  4. Send top 30Ranked by latest growth plus how steeply it's rising.

Momentum

Stocks that have outperformed for months tend to keep doing so for a while. This screen ranks the S&P 500 on several trend measures at once, so no single number dominates.

Universe: S&P 500
Source: Yahoo Finance daily prices

  1. Load 14 monthsEnough daily history to measure a full year of trend.
  2. Quality gatePrice at least $10 and $25M average daily dollar volume.
  3. Rank factors12-1, 6, 3 and 1 month returns, distance to the 52-week high, 50 and 200 day averages, volume trend.
  4. Send top 2580% trend, 20% volume, plus a bonus when the 50-day crosses above the 200-day.

What it costs

Nothing. It runs on free data sources and a small cloud budget.

What it isn't

Advice. These are mechanical screens and AI summaries, and they can be wrong. Treat them as a starting list for your own research.

Leaving

Every email ends with an unsubscribe link that works in one click. Your address is never shared or shown to other subscribers.